KPI Resource
Introduction
This Ignition Launchpad KPI project is meant to provide a base level dashboard project to get started with Ignition.
The project has four main screens:
- An Overview screen with a fixed dashboard
- A Dashboard screen that allows for building custom dashboards
- A Trending screen
- An Alarming screen
Along with the main screens, the project includes a set of widgets for building custom dashboards. The project installs fully simulated with a set of tags, which the screens are configured to work with out of the box.
Video Demonstration
In addition to the project documentation found in this section, you can watch the video demonstration included below for a brief overview of this project. Use the tabs above the video to select the language for the video narration.
- English
- Spanish
- Portuguese
- French
Overview
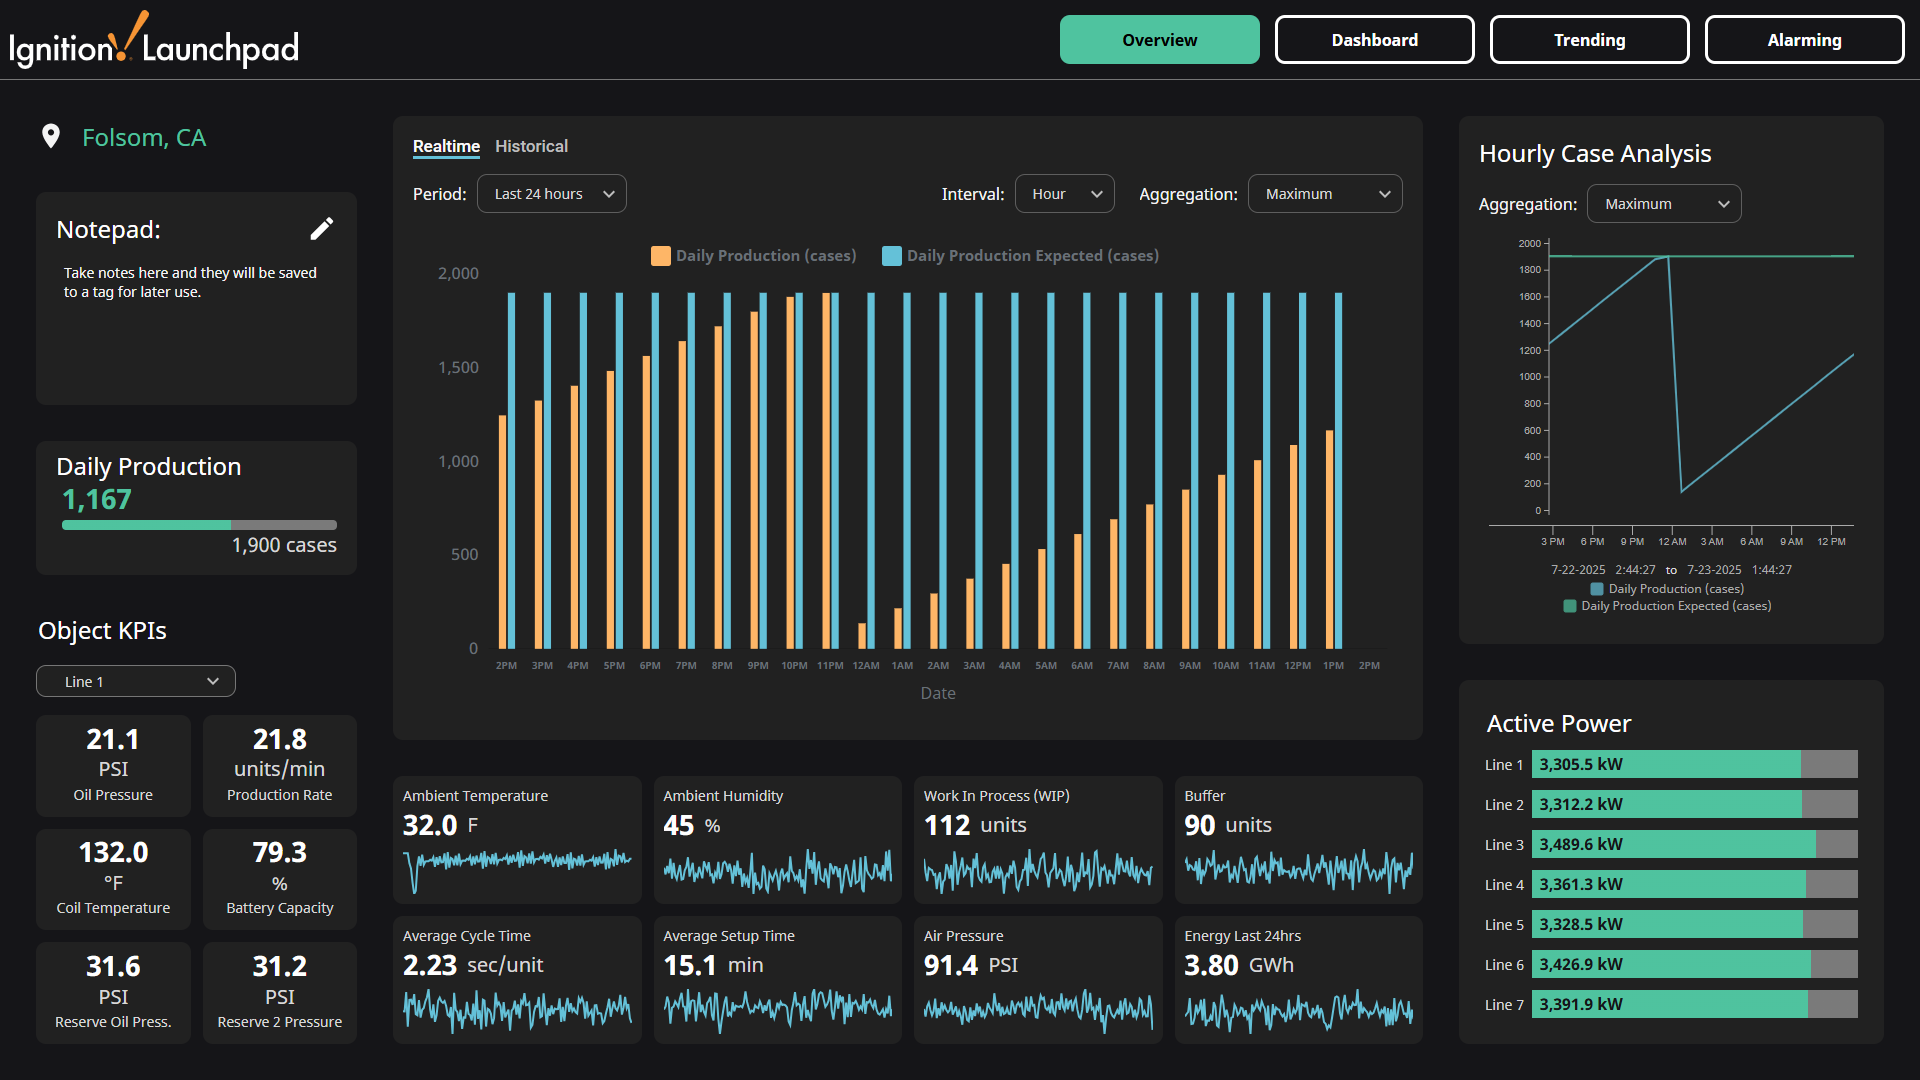
The Overview screen is an example of a dashboard built in a standard view with the widgets included in the Launchpad project. All KPI values displayed are driven by tags or tag history.
The Daily Production KPI with the progress bar on the left is considered to be the main KPI for the dashboard. The Bar Chart in the center of screen and Line Chart on the right of the screen are displaying tag history for this particular KPI.
This dashboard also includes a notepad area to add notes, six line-specific KPIs that are dynamically driven by a Line dropdown menu, several Sparkline widgets, and Progress Bar widgets.
Every widget is also clickable, which will open a popup displaying tag history in a Power Chart for the tag driving that widget, and that same tag history is also shown in a table for further analysis and insights.
If you want to use this dashboard to display your tag values instead of the simulated values, you can edit the OPC item paths for the tags included with the project, or open this Overview in the Designer, and edit the tag path parameter for the particular widget you want to use.
Dashboard
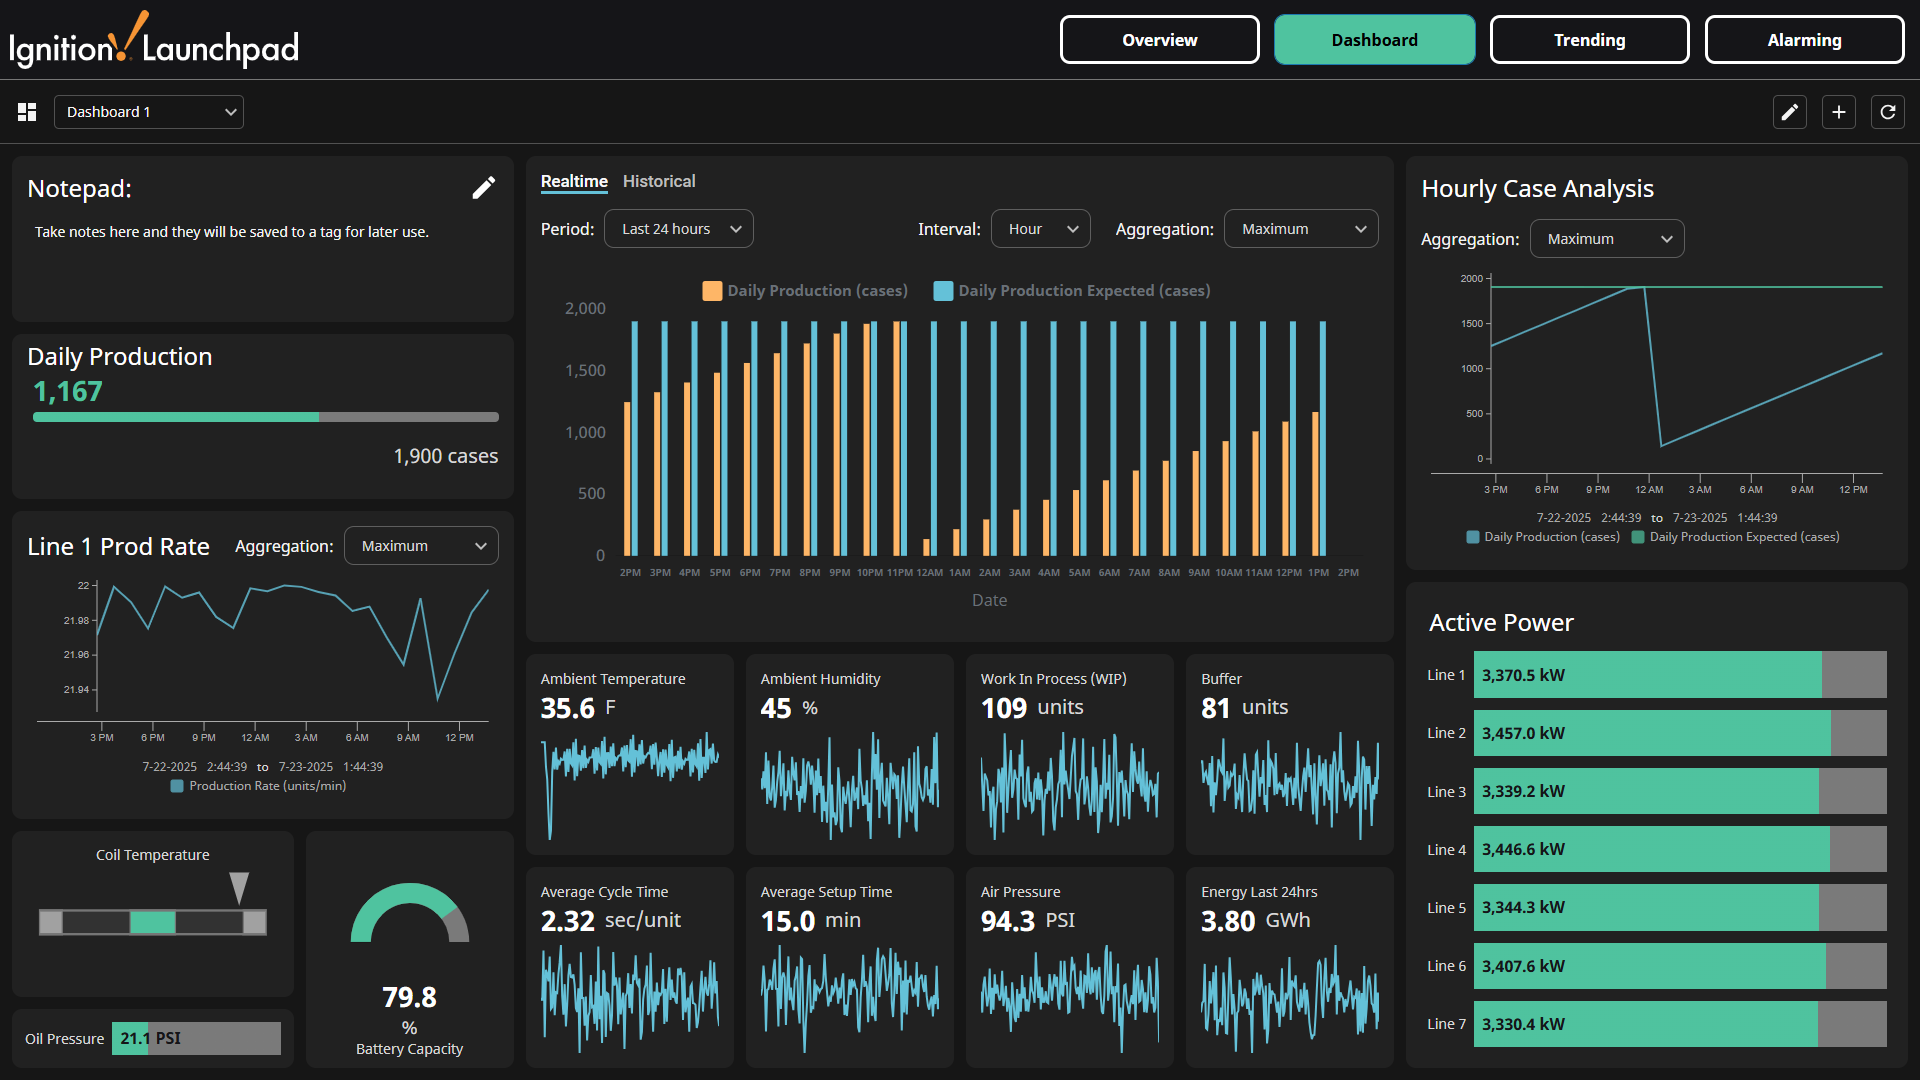
On the Dashboard screen, we see something very similar to the Overview, however, there is a key difference here. This screen leverages Ignition's Dashboard component, meaning every widget displayed here can be moved around directly in the web browser session. This will allow for rather simple customization so you can build a dashboard catered to your specific use case. Maybe you only want to display a handful of KPIs, or you don't need a historical chart, this customizable dashboard provides the flexibility to add, remove, and arrange widgets as you see fit for your Ignition Dashboard display.
You can use the dropdown in the top left to select between two pre-configured dashboards. You can also use the buttons on the top right to edit the dashboards or add a new blank dashboard to get started building your own.
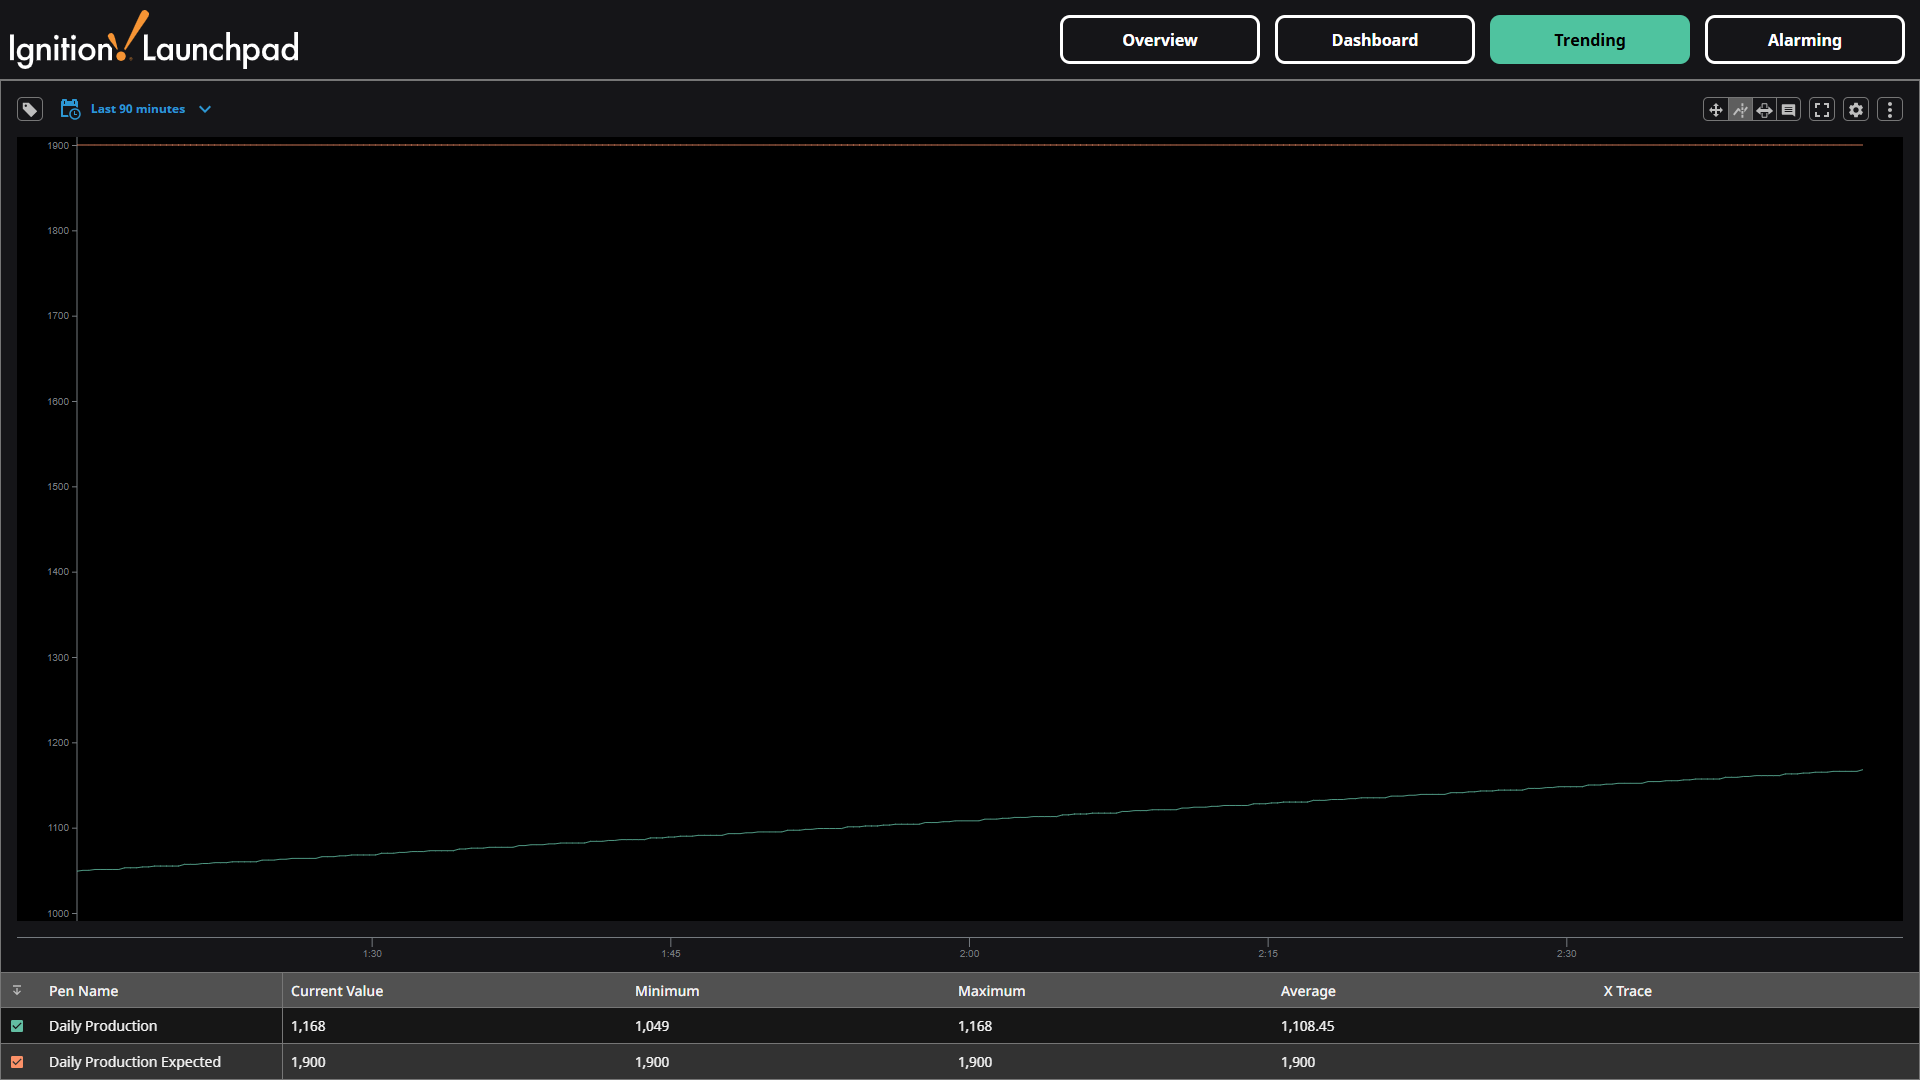
Trending
The Launchpad project has a Trending screen that includes Ignition's Power Chart component to trend tag history. Within this Power Chart you can trend any tags that have history enabled for further insights into your tag values.
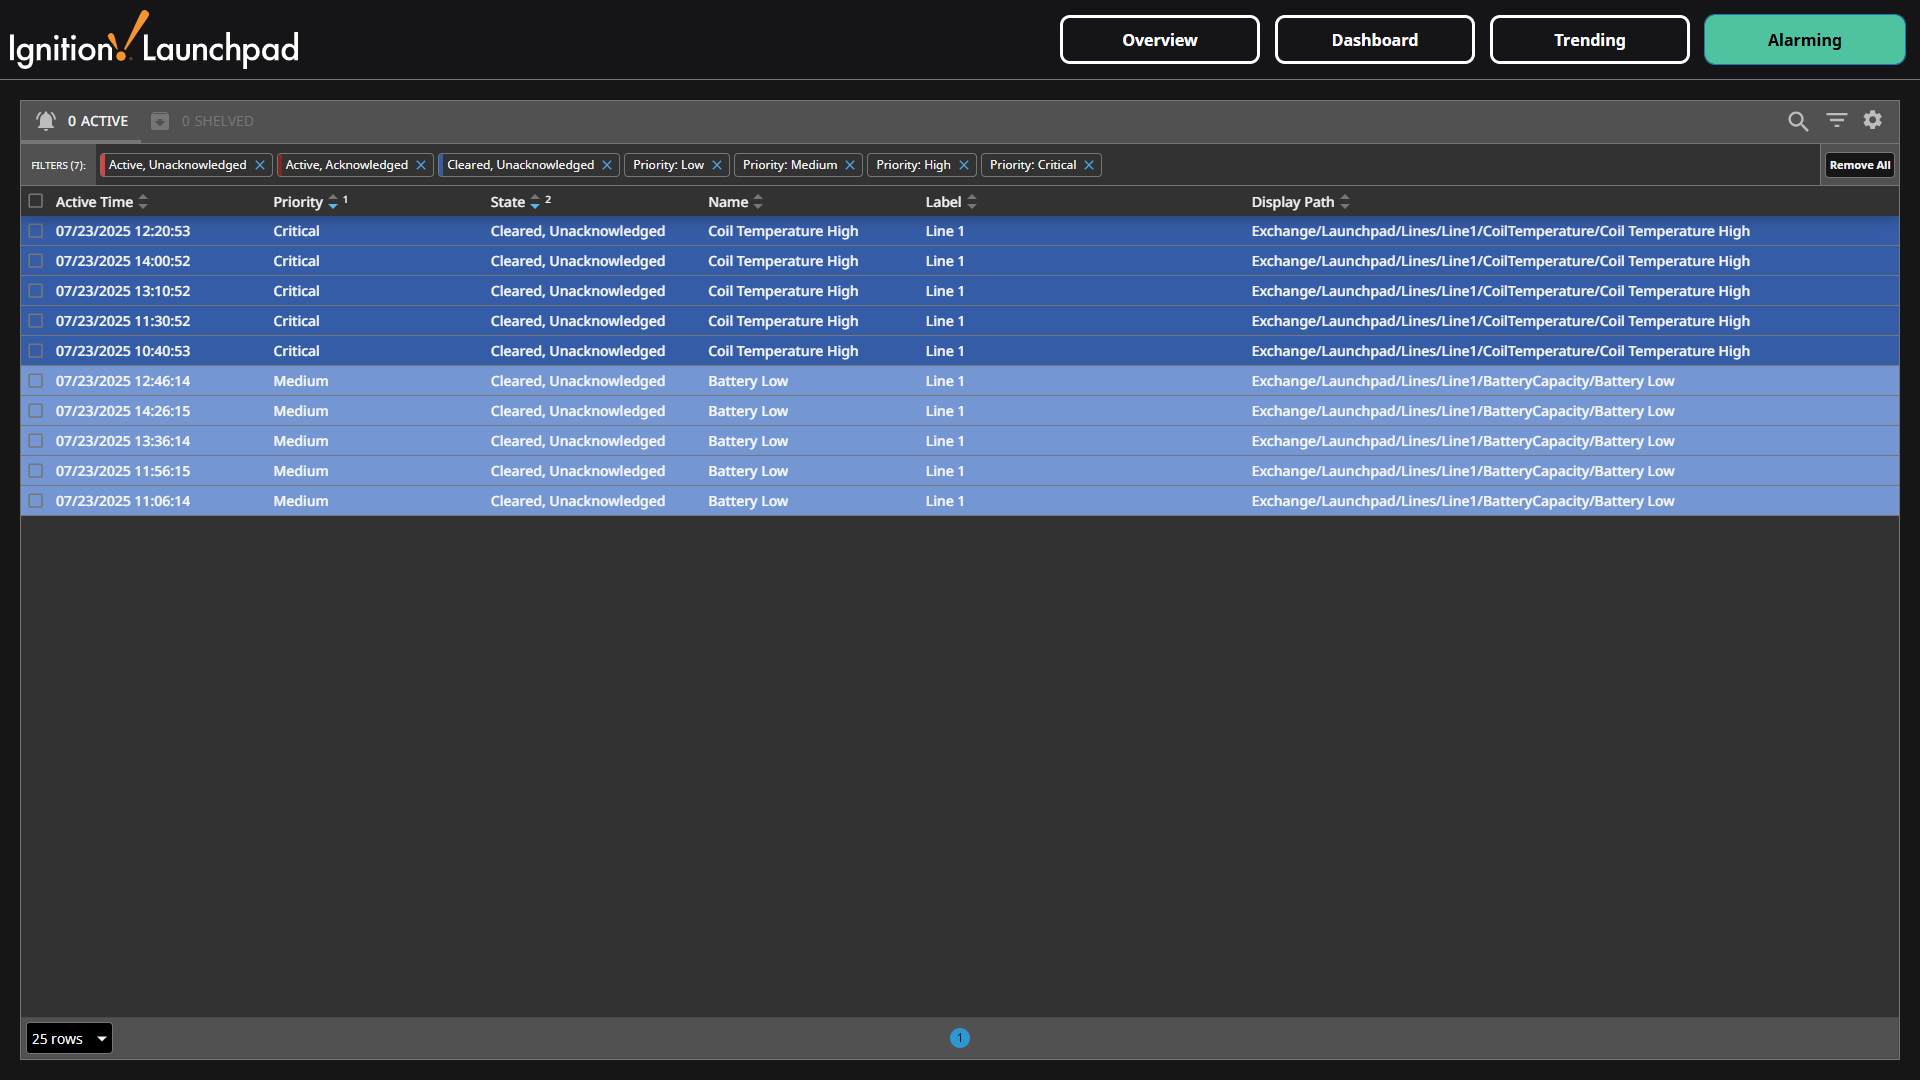
Alarming
The Alarming screen utilizes Ignition's Alarm Status Table component to view alarms, and has a handful of pre-configured alarms. These can be disabled on the tags, or you can add additional alarms as you see fit.