Overview
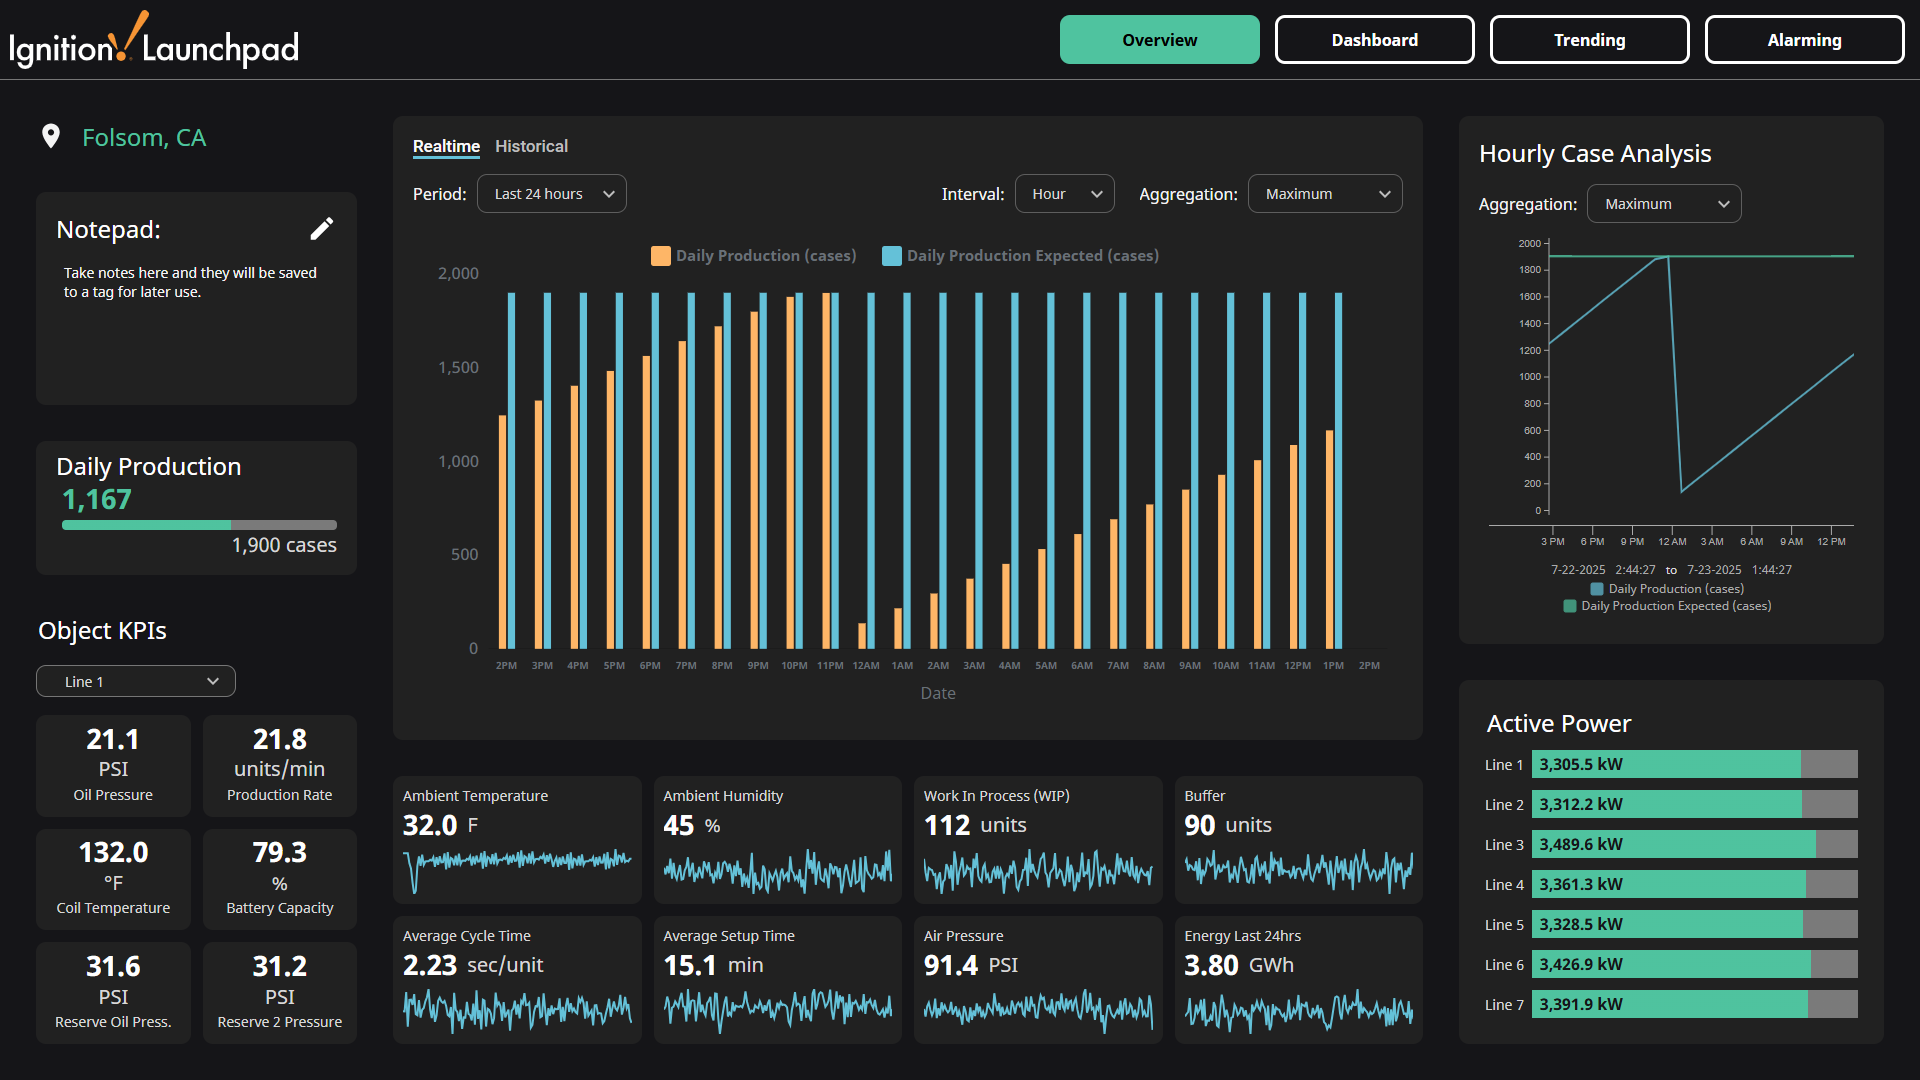
The Overview page displays an example of a static dashboard. It combines multiple components to give a quick overview of the entire site. To modify this view, users need open it in the Designer. This is different from the Dashboard view that can be modified in the browser session.
Checkout individual components for mode details.
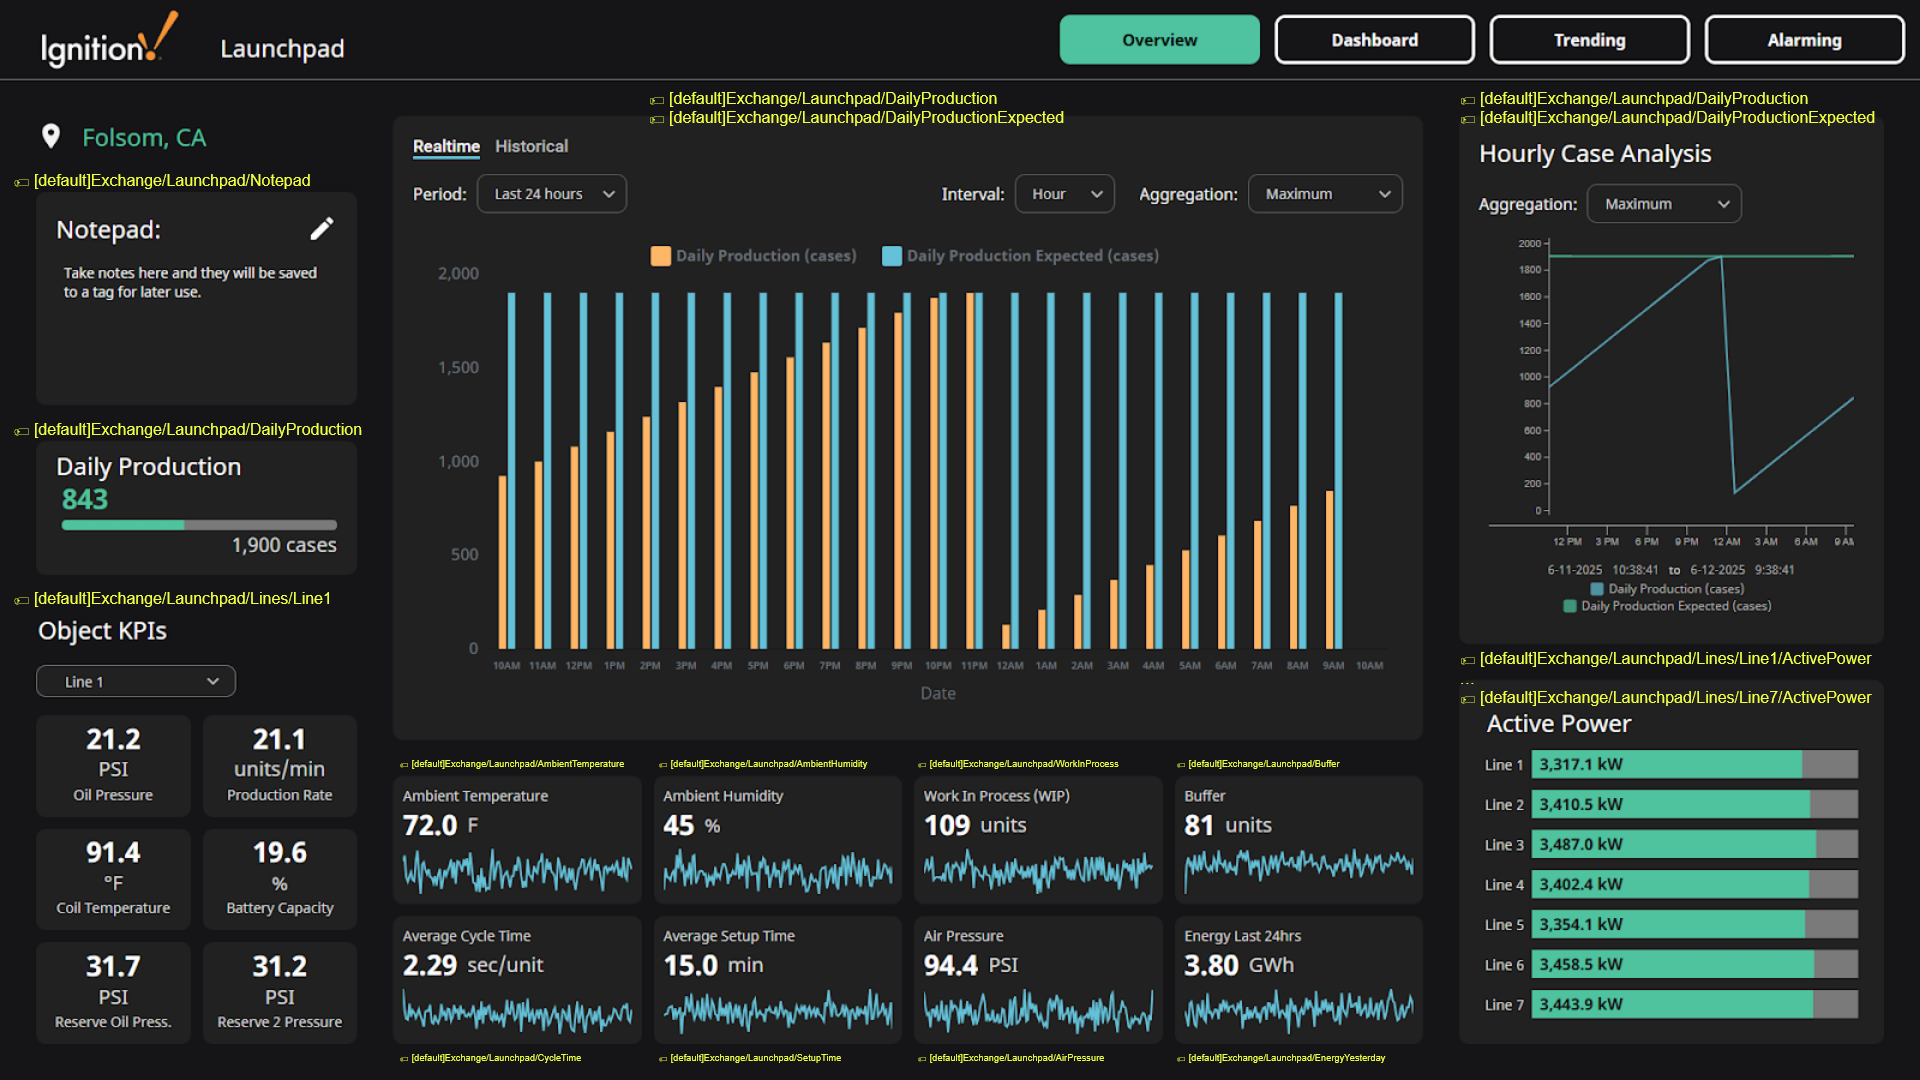
Overview Tags
The screenshot below references which tags are used in their respective components. You can click on the image to expand it.
Overview Components
Notepad
The Notepad component allows users to take notes that will be seen by anyone else looking at this dashboard.

Daily Production
The Daily Production component displays how close the site is to hitting the expected target.

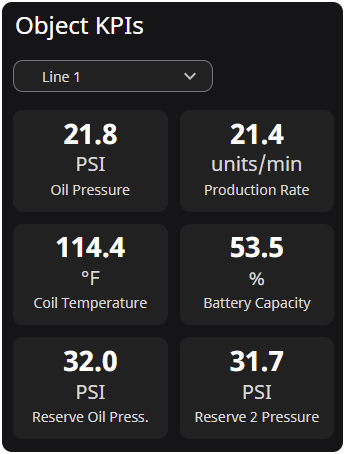
Line KPI
The Line KPI component displays specific KPIs for a selected production line. The dropdown at the top of the component allows users to switch between lines.
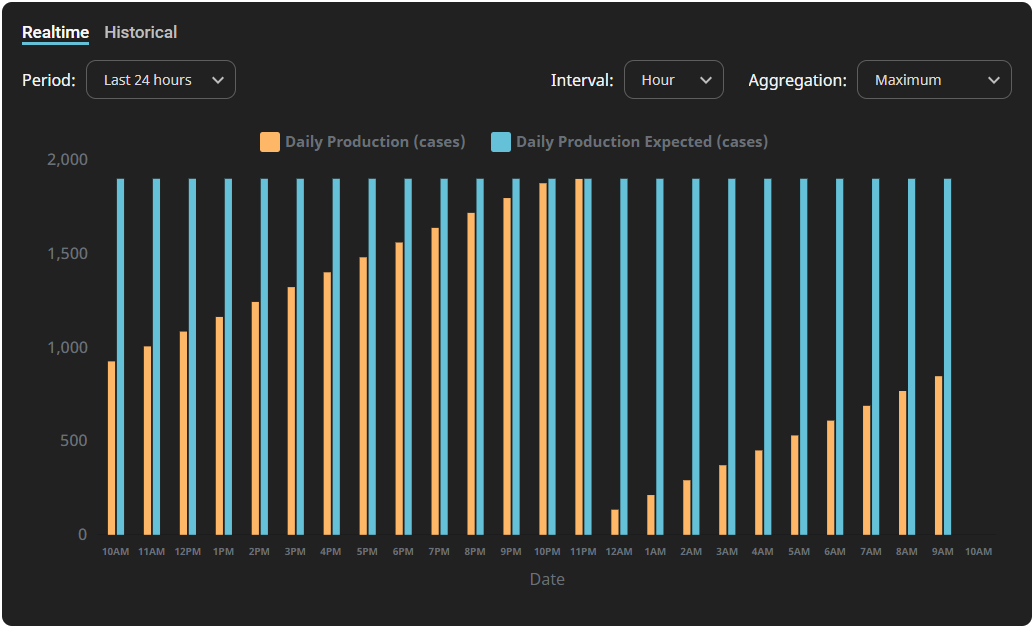
Bar Chart
The Bar Chart component displays actual and expected production counts. The exact Bar Chart display can be filtered using the Period, Interval, and Aggregation dropdown. Switching between the Realtime and Historical tabs will reveal the corresponding data.
Sparkline
The Sparkline component displays the current value, and includes a trending line that visualizes how the value changed during the last 24 hours.

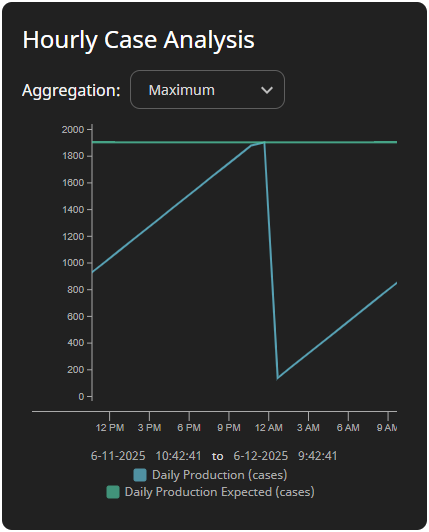
Line Chart
The Line Chart component displays actual and expected production counts.
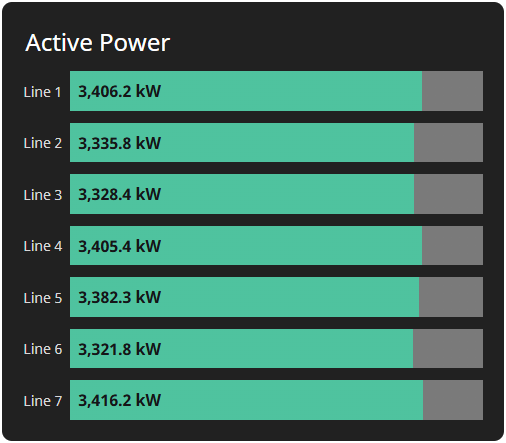
Progress KPI
The Progress KPI component displays active power of all available lines.