Trending
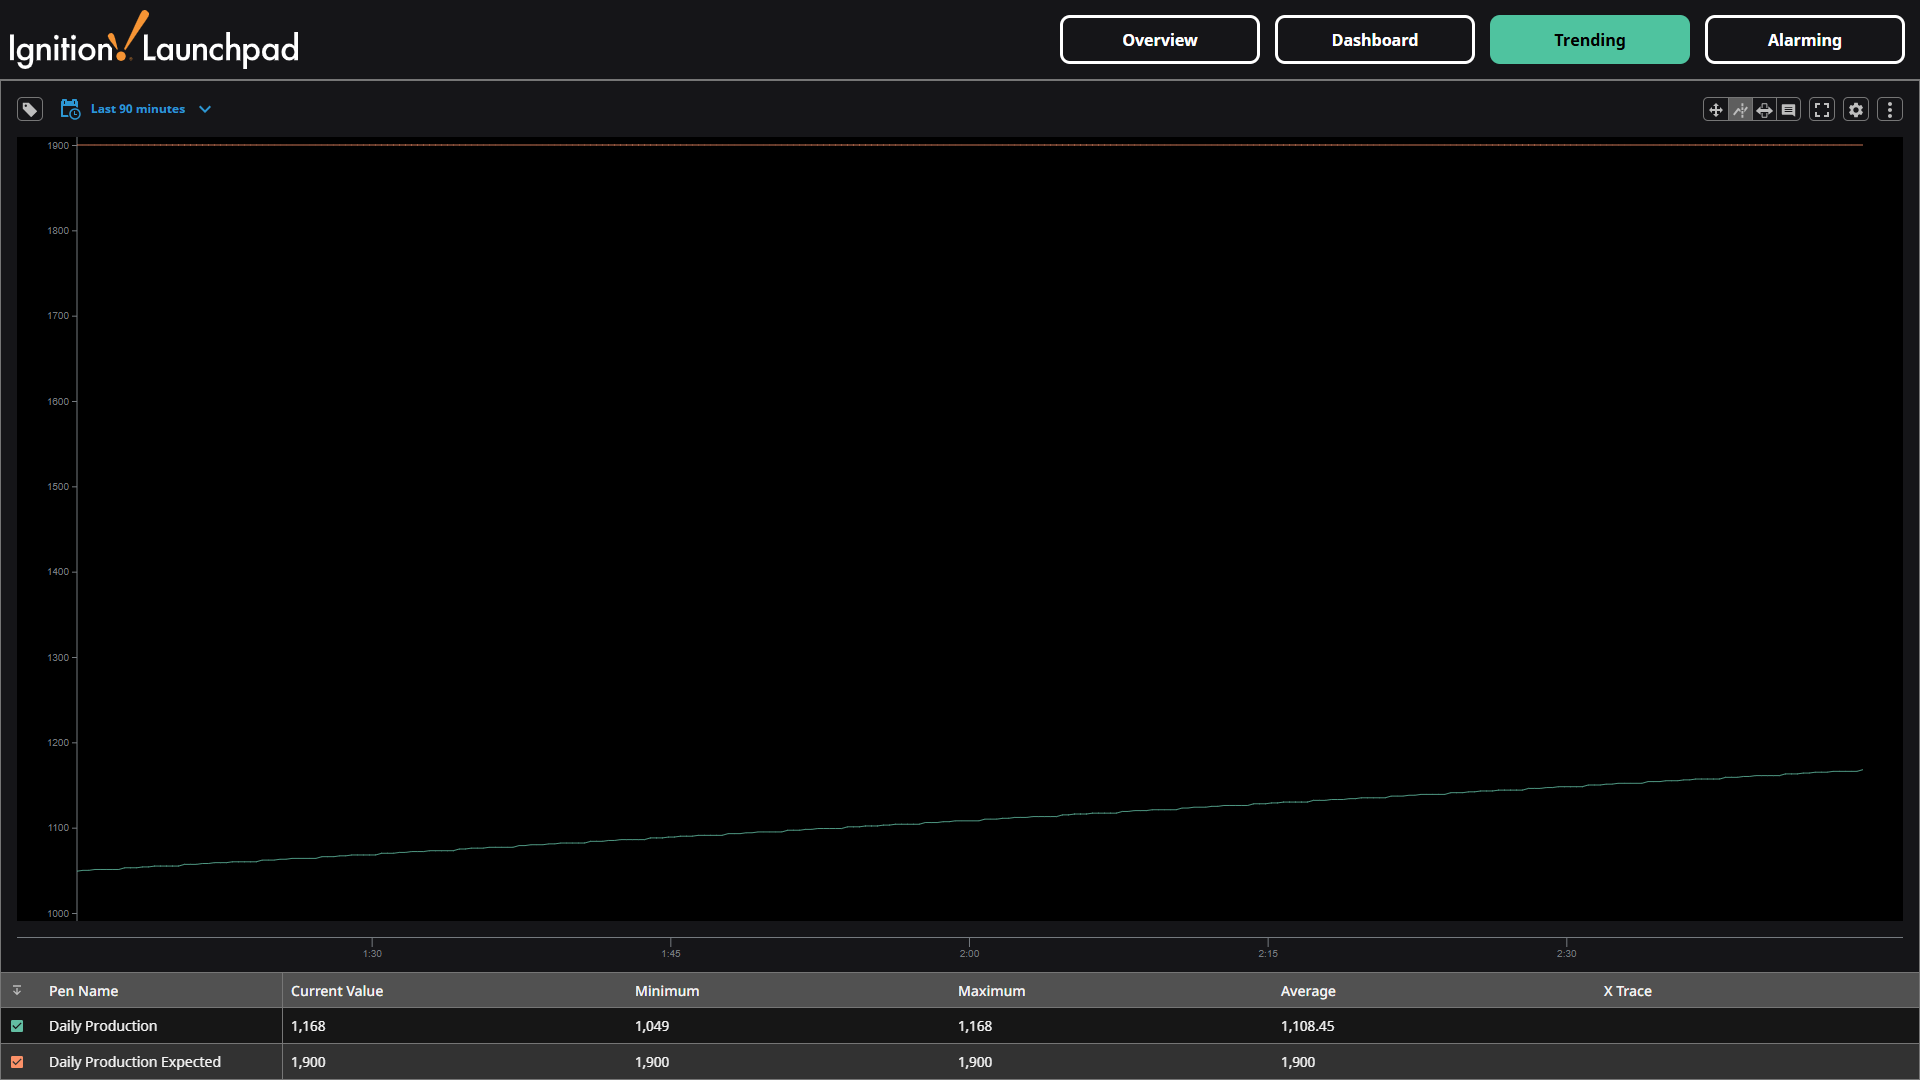
The Trending screen allows you to compare the value of any tags over a date range in a Power Chart. The Power Chart will show the current, minimum, maximum, average values.
You can interact with the Power Chart to see the values of the selected tags at any time in the selected time period, and you can use the cursor to X trace along the graph and see the values at any time.
By default, the Power Chart displays the Daily Production and Daily Production Expected tags. Use the Browse Tags list on the left side to select other tags to add on the Power Chart. You can also adjust the date/time, zoom, and other chart settings using the available functions in the upper left of the screen.