Bar Chart
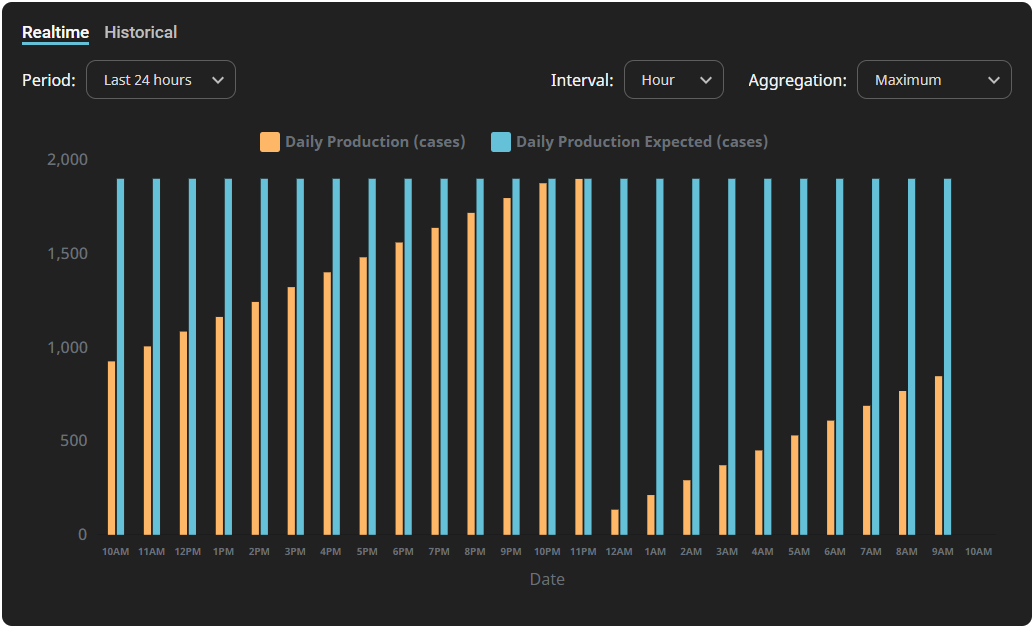
The Bar Chart component displays historical data for up to two tags, with configurable intervals, time ranges, and aggregation modes. You can adjust these settings using the dropdowns at the top of the screen.
Parameters
| Name | Data Type | Description |
|---|---|---|
| path1 | String | Path of the first historical tag. Supports both realtime and historical tag paths. Displayed in legend:Documentation: The name of the value. If unused, the tag name is displayed.EngUnit: The engineering units for the value.Example tag path: [default]Exchange/Launchpad/DailyProduction |
| path2 | String | Path of the second historical tag. Supports both realtime and historical tag paths.Displayed in legend:Documentation: The name of the value. If unused, the tag name is displayed.EngUnit: The engineering units for the value.Example tag path: [default]Exchange/Launchpad/DailyProductionExpected |
| aggMode | String | Aggregation mode used in the tag history call. Valid values include: |