Popup Dual Tag
The Popup Dual Tag component is opened when a component with two tags is clicked on the Overview and Dashboard pages, such as the Bar Chart or the Line Chart.
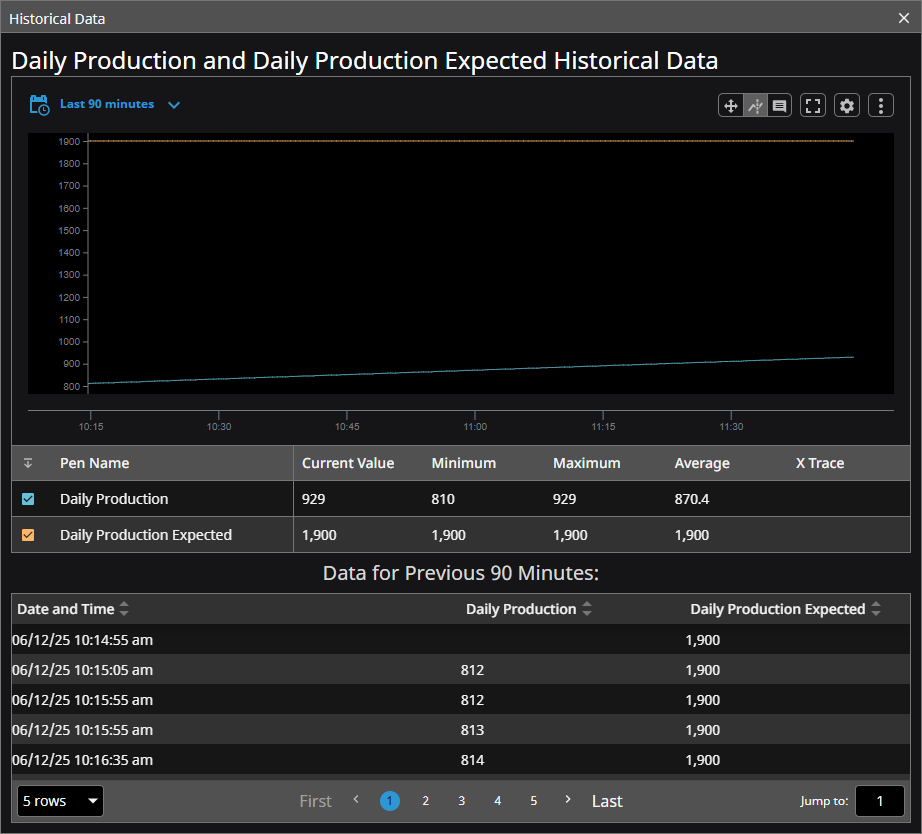
It contains a Power Chart with the tag history of the two selected tags. The Power Chart will show the current value, minimum, maximum, average, and you can use the cursor to X trace along the graph and see the values at any time. Underneath the Power Chart is a Table listing the values by the date and time they are stored in the tag history database.
Parameters
| Name | Data Type | Description |
|---|---|---|
| historyProvider | String | The name of Tag History Provider database for the selected tags, which can be found in your Ignition Gateway, under Config > Tags > History. |
| path1 | String | The first tag path to display in the Power Chart. By default, the pen for this tag is blue. If the Documentation property is configured it will be used as the title and label for the Power Chart and Table, otherwise the tag name will be used.Example tag path: [default]Exchange/Launchpad/DailyProduction |
| path2 | String | The second tag path to display in the Power Chart. By default, the pen for this tag is orange. If the Documentation property is configured it will be used as the title and label for the Power Chart and Table, otherwise the tag name will be used.Example tag path: [default]Exchange/Launchpad/DailyProductionExpected |