Line Chart
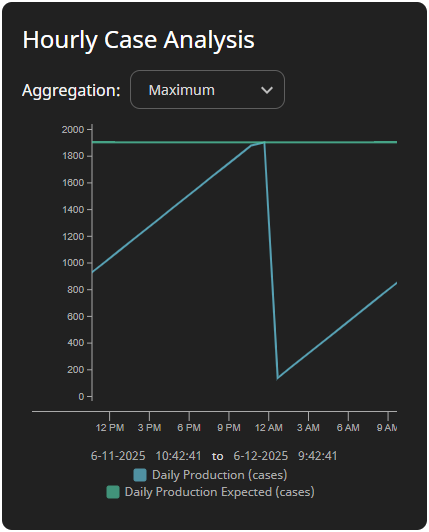
The Line Chart component displays 24-hour history in 1-hour intervals for up to two historical tags. It features a configurable title, a legend, and a dropdown to change the aggregation mode.
Parameters
| Name | Data Type | Description |
|---|---|---|
| path1 | String | Path of the first historical tag. Supports both realtime and historical tag paths. Displayed in legend:Documentation: The name of the value. If unused, the tag name is displayed.EngUnit: The engineering units for the value.Example tag path: [default]Exchange/Launchpad/DailyProduction |
| path2 | String | Path of the second historical tag. Supports both realtime and historical tag paths. Displayed in legend:Documentation: The name of the value. If unused, the tag name is displayed.EngUnit: The engineering units for the value.Example tag path: [default]Exchange/Launchpad/DailyProductionExpected |
| title | String | Title displayed in the top left of the component. |
| aggMode | String | Aggregation mode used in the tag history call. Valid values include: |