Line View
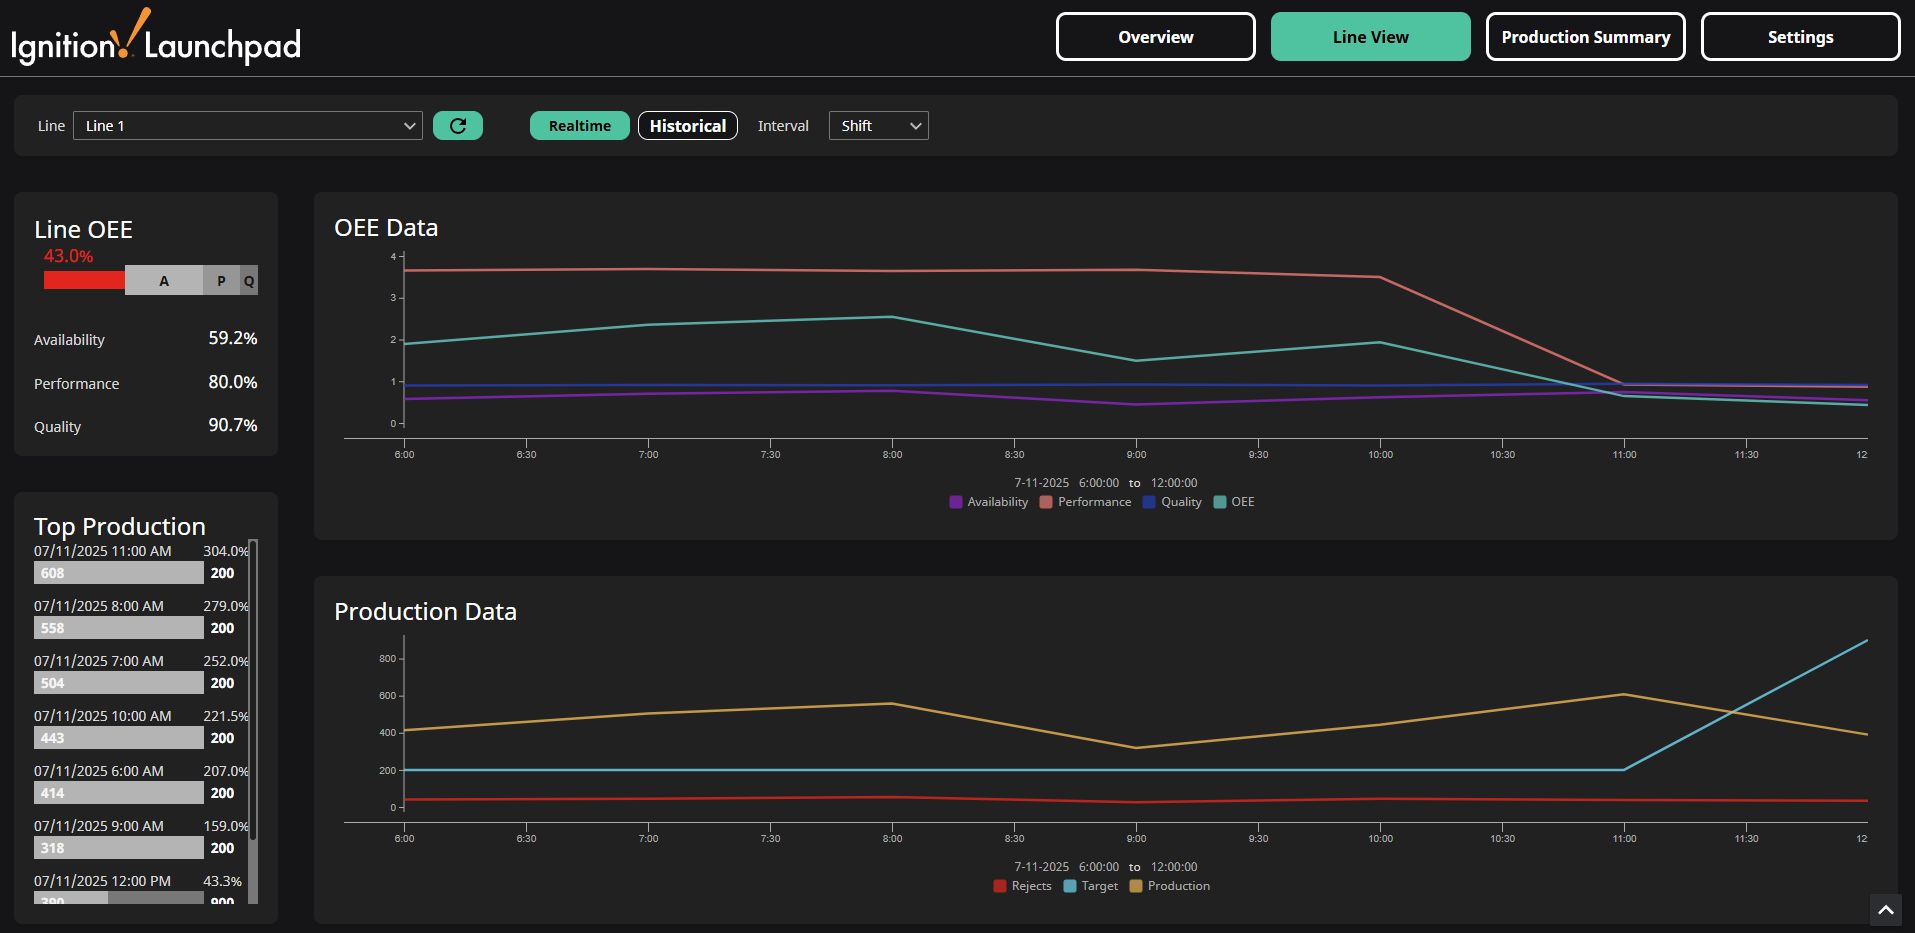
The Line View screen shows hourly trending data for the selected line in an OEE Data chart and a Production Data Chart along with an hourly bar chart showing the most productive hours in the selected time period. The OEE values displayed on this page can be toggled between Realtime and Historical modes using the buttons at the top of the page.
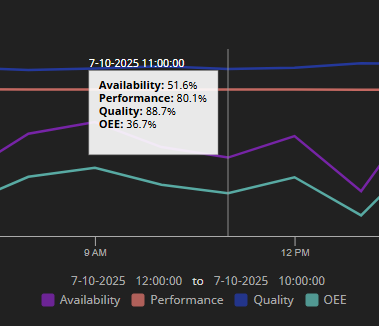
If you hover your mouse cursor over either of the charts, an X-trace will appear showing the values at that time.
Realtime Mode
Realtime mode provides hourly trending, status and OEE values for the current hour, day or shift.
-
The OEE Data Line Chart shows the Availability, Performance, Quality and OEE at each hour.
-
The Production Data Line Chart shows the Target Production, Actual Production and Rejects for each hour.
Realtime mode provides OEE and production values for the current interval selected in the interval dropdown. Interval options include day, shift, and hour. The available values listed below are calculated from the start time for the selected interval:
- Current Status (Running/Stopped/Faulted)
- Target Production Rate
- Current Production Rate
- Units Produced since start of interval
- Availability: Run Time / Planned Production Time
- Performance: (Ideal Cycle Time × Total Count) / Run Time
- Quality: Good Count / Total Count
- Utilization: Planned Production Time / All Time
- OEE: Availability × Performance × Quality
Intervals
- Day
- OEE calculated from 12:00 AM until 11:59 PM today.
- Hourly Production data from from 12:00 AM today until 11:59 PM today.
- Shift
- OEE calculated from the start to the end of the currently scheduled shift for the selected line. "Not Scheduled" will display on any Line Cards without a currently scheduled shift.
- Hourly Production data from start of the current shift. The entire day is displayed if there no current shift for the selected line.
- Hour
- OEE calculated from from start of the hour
- Hourly Production data from from 12:00 AM today. Note values are not yet recorded for the current hour, so the day trend is shown in hour mode.
Example: A shift is scheduled to run from 10:00 PM yesterday to 6:00 AM today. At 5:30 AM, if you selected Day, you would see the data from 12:00 AM to 5:30 AM today. If you selected Shift, you would see data from 10:00 PM yesterday to 5:30 AM today. If you selected Hour, you would see data from 5:00 AM to 5:30 AM today.
Historical Mode
Historical mode provides hourly trending, total production, and average OEE values for the selected interval.
-
OEE Data trend shows the Availability, Performance, Quality and OEE at each hour.
-
Production Data trend shows the Target Production, Actual Production and Rejects for each hour.

OEE and production values aggregated over the selected time range:
- Average Availability: Run Time / Planned Production Time
- Average Performance: (Ideal Cycle Time × Total Count) / Run Time
- Average Quality: Good Count / Total Count
- Average Utilization: Planned Production Time / All Time
- OEE: Availability × Performance × Quality
- Total Units Produced
Periods
When Historical mode is enabled, a Period dropdown will appear. You can select from default periods of time or you can use the date/time selectors to change the start and end dates to anything you like, which will deselect the selected period from the dropdown. The default periods of time are described in the table below.
| Period | Explanation |
|---|---|
| Yesterday | Yesterday 12:00:00 AM to Yesterday 11:59:59 PM |
| This Week | Sunday 12:00:00 AM to Today 11:59:59 PM |
| Last Week | Last Sunday 12:00:00 AM to Last Saturday 11:59:59 PM |
| This Month | First day of this Month 12:00:00 AM to Today 11:59:59 PM |
| Last Month | First day of last Month 12:00:00 AM to last day of last Month 11:59:59 PM |
| Last 30 days | Today - 30 days 12:00:00 AM to Today 11:59:59 PM |
| This Quarter* | First day of this Quarter 12:00:00 AM to last day of this Quarter 11:59:59 PM |
| Last Quarter* | First day of last Quarter 12:00:00 AM to last day of last Quarter 11:59:59 PM |
| Year to Date | First day of the Year 12:00:00 AM to Today 11:59:59 PM |
| Last 365 days | Today - 365 days 12:00:00 AM to Today 11:59:59 PM |
*Q1 is January to March, Q2 is April to June, Q3 is July to September, Q4 is October to December