Overview
The Overview screen displays either realtime or historical production data for each line depending on the selected mode. OEE and Downtime percentages are also compared on the side of the screen for each line.
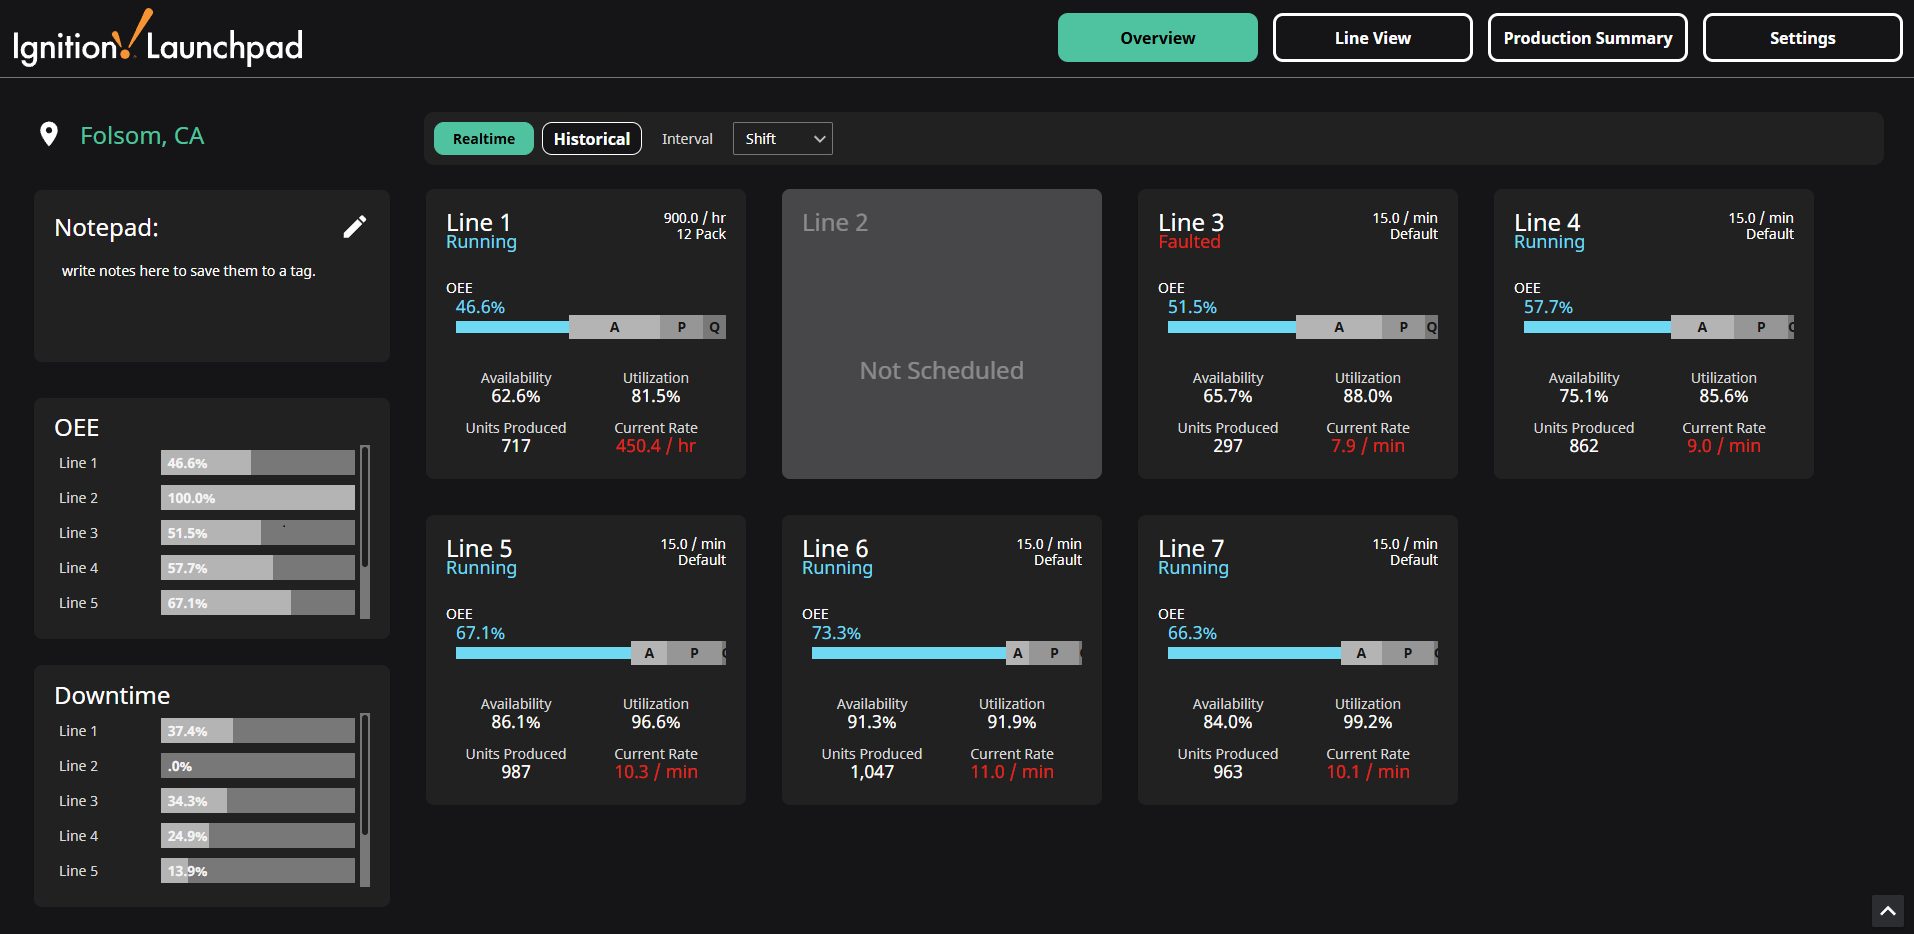
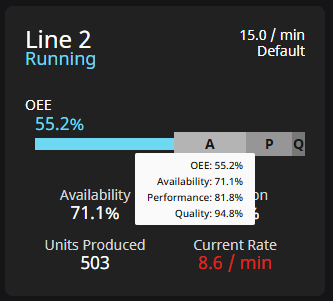
The main page area utilizes Line Cards to display OEE data with a variety of components. A slider bar is used to display the OEE value for the line, and when hovered over, a tooltip will appear to additionally display Availability, Performance, and Quality for that line. The Line Cards also show status of the line (Running, Faulted, or Stopped), current rate and target rate details, and production count. For more information on rates, see the Settings page Rates section.
Clicking a Line Card navigates to the Line View for the line selected, with the same realtime or historical settings.
The Overview screen also has a location component to display the location of the plant, and a Notepad component to record notes to a tag for later use.
Realtime Mode
Realtime mode provides status, OEE, and production values for the current interval selected in the interval dropdown. Interval options include day, shift, and hour. The available values listed below are calculated from the start time for the selected interval:
- Current Status (Running/Stopped/Faulted)
- Target Production Rate
- Current Production Rate
- Units Produced
- Availability: Run Time / Planned Production Time
- Performance: (Ideal Cycle Time × Total Count) / Run Time
- Quality: Good Count / Total Count
- Utilization: Planned Production Time / All Time
- OEE: Availability × Performance × Quality
Intervals
- Day - From 12:00 AM until 11:59 PM today.
- Shift - From the start to the end of the currently scheduled shift for the selected line. "Not Scheduled" will display on any Line Cards without a currently scheduled shift.
- Hour - Start of the hour. "Not Scheduled" will display for lines if at least one shift is scheduled and not currently running.
Example: A shift is scheduled to run from 10:00 PM yesterday to 6:00 AM today. At 5:30 AM, if you selected Day, you would see the data from 12:00 AM to 5:30 AM today. If you selected Shift, you would see data from 10:00 PM yesterday to 5:30 AM today. If you selected Hour, you would see data from 5:00 AM to 5:30 AM today.
Historical Mode
Historical mode provides total production and average OEE values for the selected period. These values are:
- Average Production Rate
- Average Availability: Run Time / Planned Production Time
- Average Performance: (Ideal Cycle Time × Total Count) / Run Time
- Average Quality: Good Count / Total Count
- Average Utilization: Planned Production Time / All Time
- OEE: Availability × Performance × Quality
- Total Units Produced
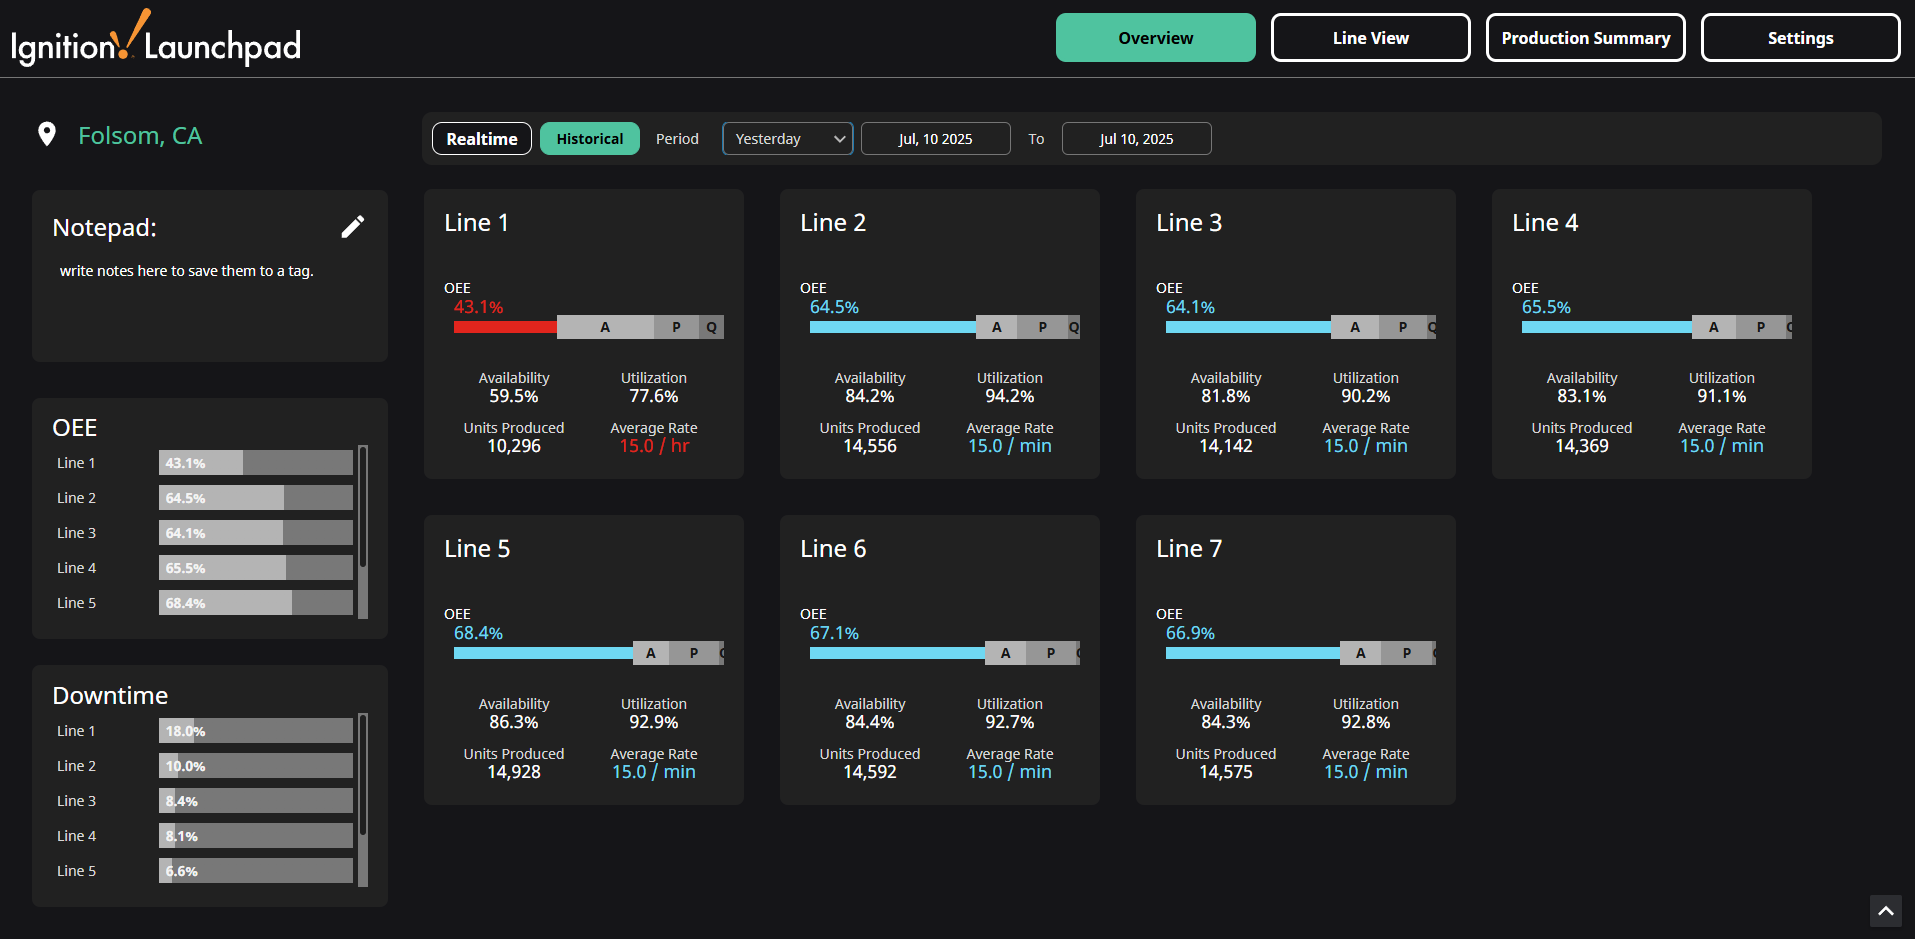
Periods
When Historical mode is enabled, a Period dropdown will appear. You can select from default periods of time or you can use the date/time selectors to change the start and end dates to anything you like, which will deselect the selected period from the dropdown. The default periods of time are described in the table below.
| Period | Explanation |
|---|---|
| Yesterday | Yesterday 12:00:00 AM to Yesterday 11:59:59 PM |
| This Week | Sunday 12:00:00 AM to Today 11:59:59 PM |
| Last Week | Last Sunday 12:00:00 AM to Last Saturday 11:59:59 PM |
| This Month | First day of this Month 12:00:00 AM to Today 11:59:59 PM |
| Last Month | First day of last Month 12:00:00 AM to last day of last Month 11:59:59 PM |
| Last 30 days | Today - 30 days 12:00:00 AM to Today 11:59:59 PM |
| This Quarter* | First day of this Quarter 12:00:00 AM to last day of this Quarter 11:59:59 PM |
| Last Quarter* | First day of last Quarter 12:00:00 AM to last day of last Quarter 11:59:59 PM |
| Year to Date | First day of the Year 12:00:00 AM to Today 11:59:59 PM |
| Last 365 days | Today - 365 days 12:00:00 AM to Today 11:59:59 PM |
*Q1 is January to March, Q2 is April to June, Q3 is July to September, Q4 is October to December