Production Summary
The Production Summary screen displays tabular historical data. You can toggle between the Line Summary mode to show a summary across all lines for the selected period, or the Line mode to show one or all lines over the selected period, but with a row per line per interval selected (Day, Shift, or Hour).
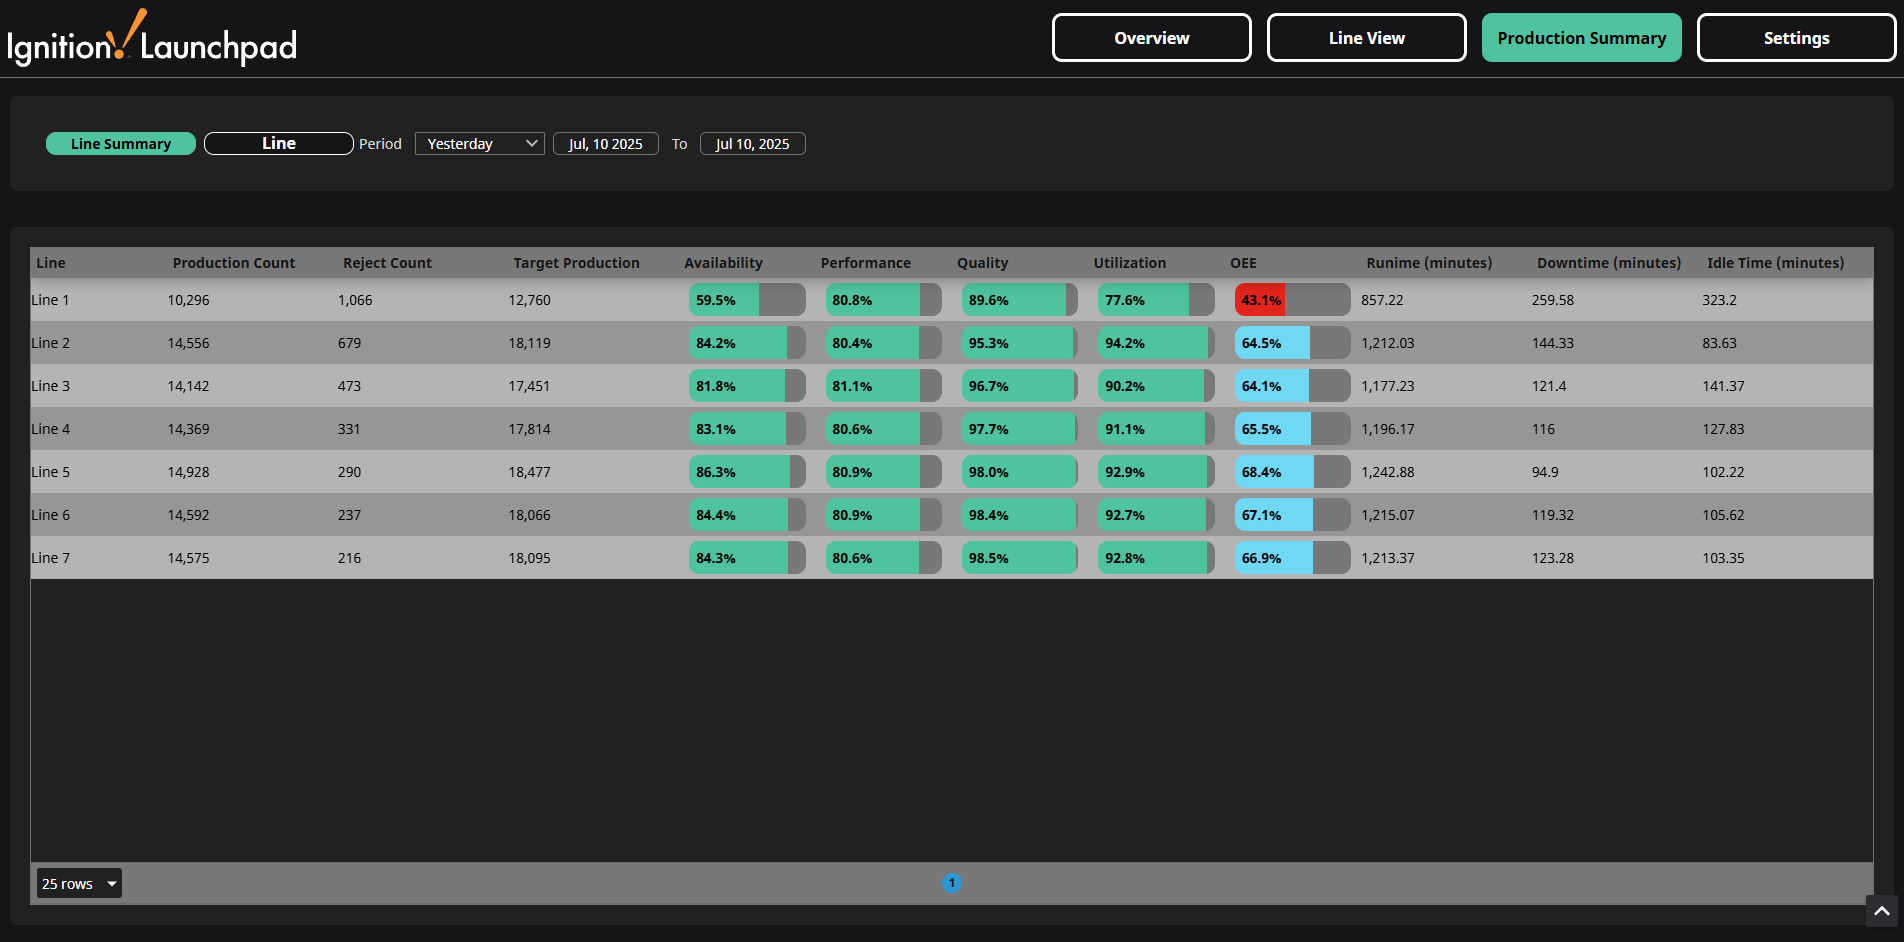
Line Summary Mode
The Line Summary mode displays production data for all lines aggregated over the selected period:
- Total Production, Reject, and Target counts
- Average Availability, Performance, Quality, Utilization, and OEE (as progress bars)
- Total Runtime (state = 1), Downtime (state = 2) and Idle Time (state = 0) in minutes
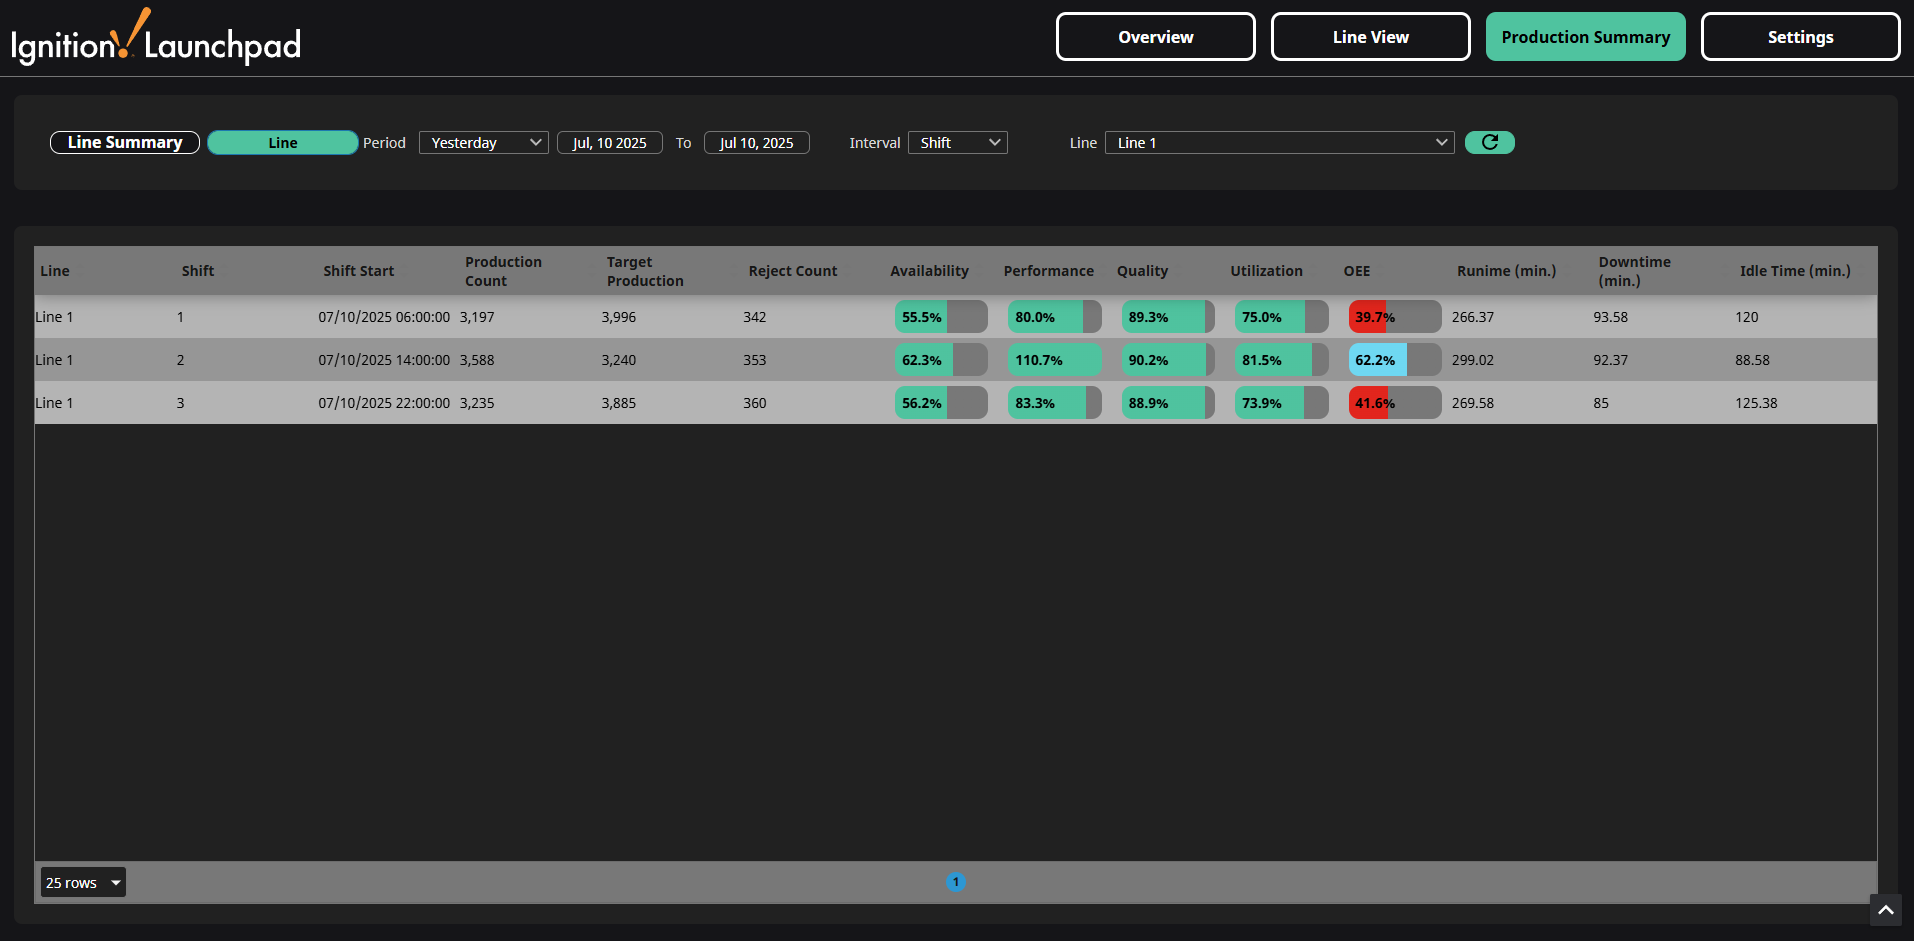
Line Mode
The Line mode displays production data for a single line or all lines based on the selection from the Line dropdown. Displayed data can be further selected using the period and interval settings.
- Total Production, Reject, and Target counts
- Availability, Performance, Quality, Utilization, and OEE (as progress bars)
- Total Runtime, Downtime, and Idle Time in minutes
Intervals
In Line mode, you can select an interval to group the data in the table. Each row of data will correspond to one line over that selected interval.
- Day
- Data from 12:00 AM to 11:59 PM each day.
- Day column will appear to show which day each row of data is for.
- Shift
- Data grouped by each scheduled shift for the selected line.
- Shift column (either 1, 2, or 3) as well as the Shift Start date/time columns will appear to show which shift each row of data is for.
- Hour
- Data for by each hour
- Hour column will appear to show which hour each row of data is for.
Periods
For both Line Summary mode and Line mode, you can use the Period dropdown to select from default periods of time to show all data over that time period. You can also use the date/time selectors to change the start and end dates to anything you like, which will deselect the selected period from the dropdown. The default periods of time are described in the table below.
| Period | Explanation |
|---|---|
| Yesterday | Yesterday 12:00:00 AM to Yesterday 11:59:59 PM |
| This Week | Sunday 12:00:00 AM to Today 11:59:59 PM |
| Last Week | Last Sunday 12:00:00 AM to Last Saturday 11:59:59 PM |
| This Month | First day of this Month 12:00:00 AM to Today 11:59:59 PM |
| Last Month | First day of last Month 12:00:00 AM to last day of last Month 11:59:59 PM |
| Last 30 days | Today - 30 days 12:00:00 AM to Today 11:59:59 PM |
| This Quarter* | First day of this Quarter 12:00:00 AM to last day of this Quarter 11:59:59 PM |
| Last Quarter* | First day of last Quarter 12:00:00 AM to last day of last Quarter 11:59:59 PM |
| Year to Date | First day of the Year 12:00:00 AM to Today 11:59:59 PM |
| Last 365 days | Today - 365 days 12:00:00 AM to Today 11:59:59 PM |
*Q1 is January to March, Q2 is April to June, Q3 is July to September, Q4 is October to December